Tabarnac example
This page presents TABARNAC visualization through the example of the IS Benchmark form the NAS Parallel Benchmarks (OpenMP). We choose this example as, according to the NAS website, IS has a random memory access pattern, while TABARNAC shows that the pattern is actually not that random.
Original behavior
We traced IS in class B (memory usage of 0.25Gib), on a 64 threas NUMA machine. The full TABARNAC visualization is available here.
For this example we focus on the plots of the section "Access distribution", e can see that each structure has a different access pattern: key_array's access distribution shows that each thread works on a different part of the structure, which permits automated tools perform an efficient data/thread mapping on it. On the other hand, key_buff2 is completely shared by all threads. key_buff1's access distribution (Figure~) is the most interesting one. We can see that almost all accesses occur in pages in the middle of the structure (from page 500 to 1500), and those pages are shared by all threads. This means that the number of access per page for each thread follows a Gaussian distribution centered in the middle of the structure.
We can identify the source of this pattern in the IS source code. Indeed, all the accesses to key_buff1 are linear, except in one OpenMP parallel loop where they depend on the value of key_buff2.
Modified behavior
As we noticed that the values of key_buff2 follow a Gaussian distribution, we can design a distribution of the threads that provides both a good load balancing and locality of data. By default, OpenMP threads are scheduled dynamically to avoid unbalanced distribution of work, but the developers also propose a cyclic distribution of the threads over the loop. For our distribution, we split the loop into two equal parts and distribute each part among the threads in a round-robin way. This modification can be done by simply changing one line of code, the \#pragma omp before the parallel loop.
The memory behavior obtained with this code modification is displayed here. By focusing again on the plots of section "Access distribution", we can see that now each thread accesses a different part of key_buff1. Furthermore, if most of the accesses still occur in the middle of the structure, the average number of access across the structure is the same for all threads, which means that our distribution preserves the good load balancing. Our modification has also changed key_buff2's accesses distribution. We can see that each thread uses mostly one part of the array and again the load balance is preserved.
Evalution
The main point of our code modification is to improve the affinity between thread and memory, therefore we need to pin each thread on a core to keep them close to the data they access. To perform the thread mapping, we use the GOMP_CPU_AFFINITY environment variable. TABARNAC also shows us that the first touch is always done by the thread actually using the data for IS, therefore we do not need to explicitly map the data to the NUMA nodes.
We compare the execution time of IS (class D, memory prin 33.5Gib) for the three scheduling methods, Dynamic, Cyclic with a step of 1 and TABARNAC: cyclic with the proposed distribution. For the two first methods, we compare the execution time on the base operating system, the interleave policy and with NUMA balancing enabled. As we map threads manually, interleave and NUMA Balancing are not relevant with our modifications and are therefore not evaluated.
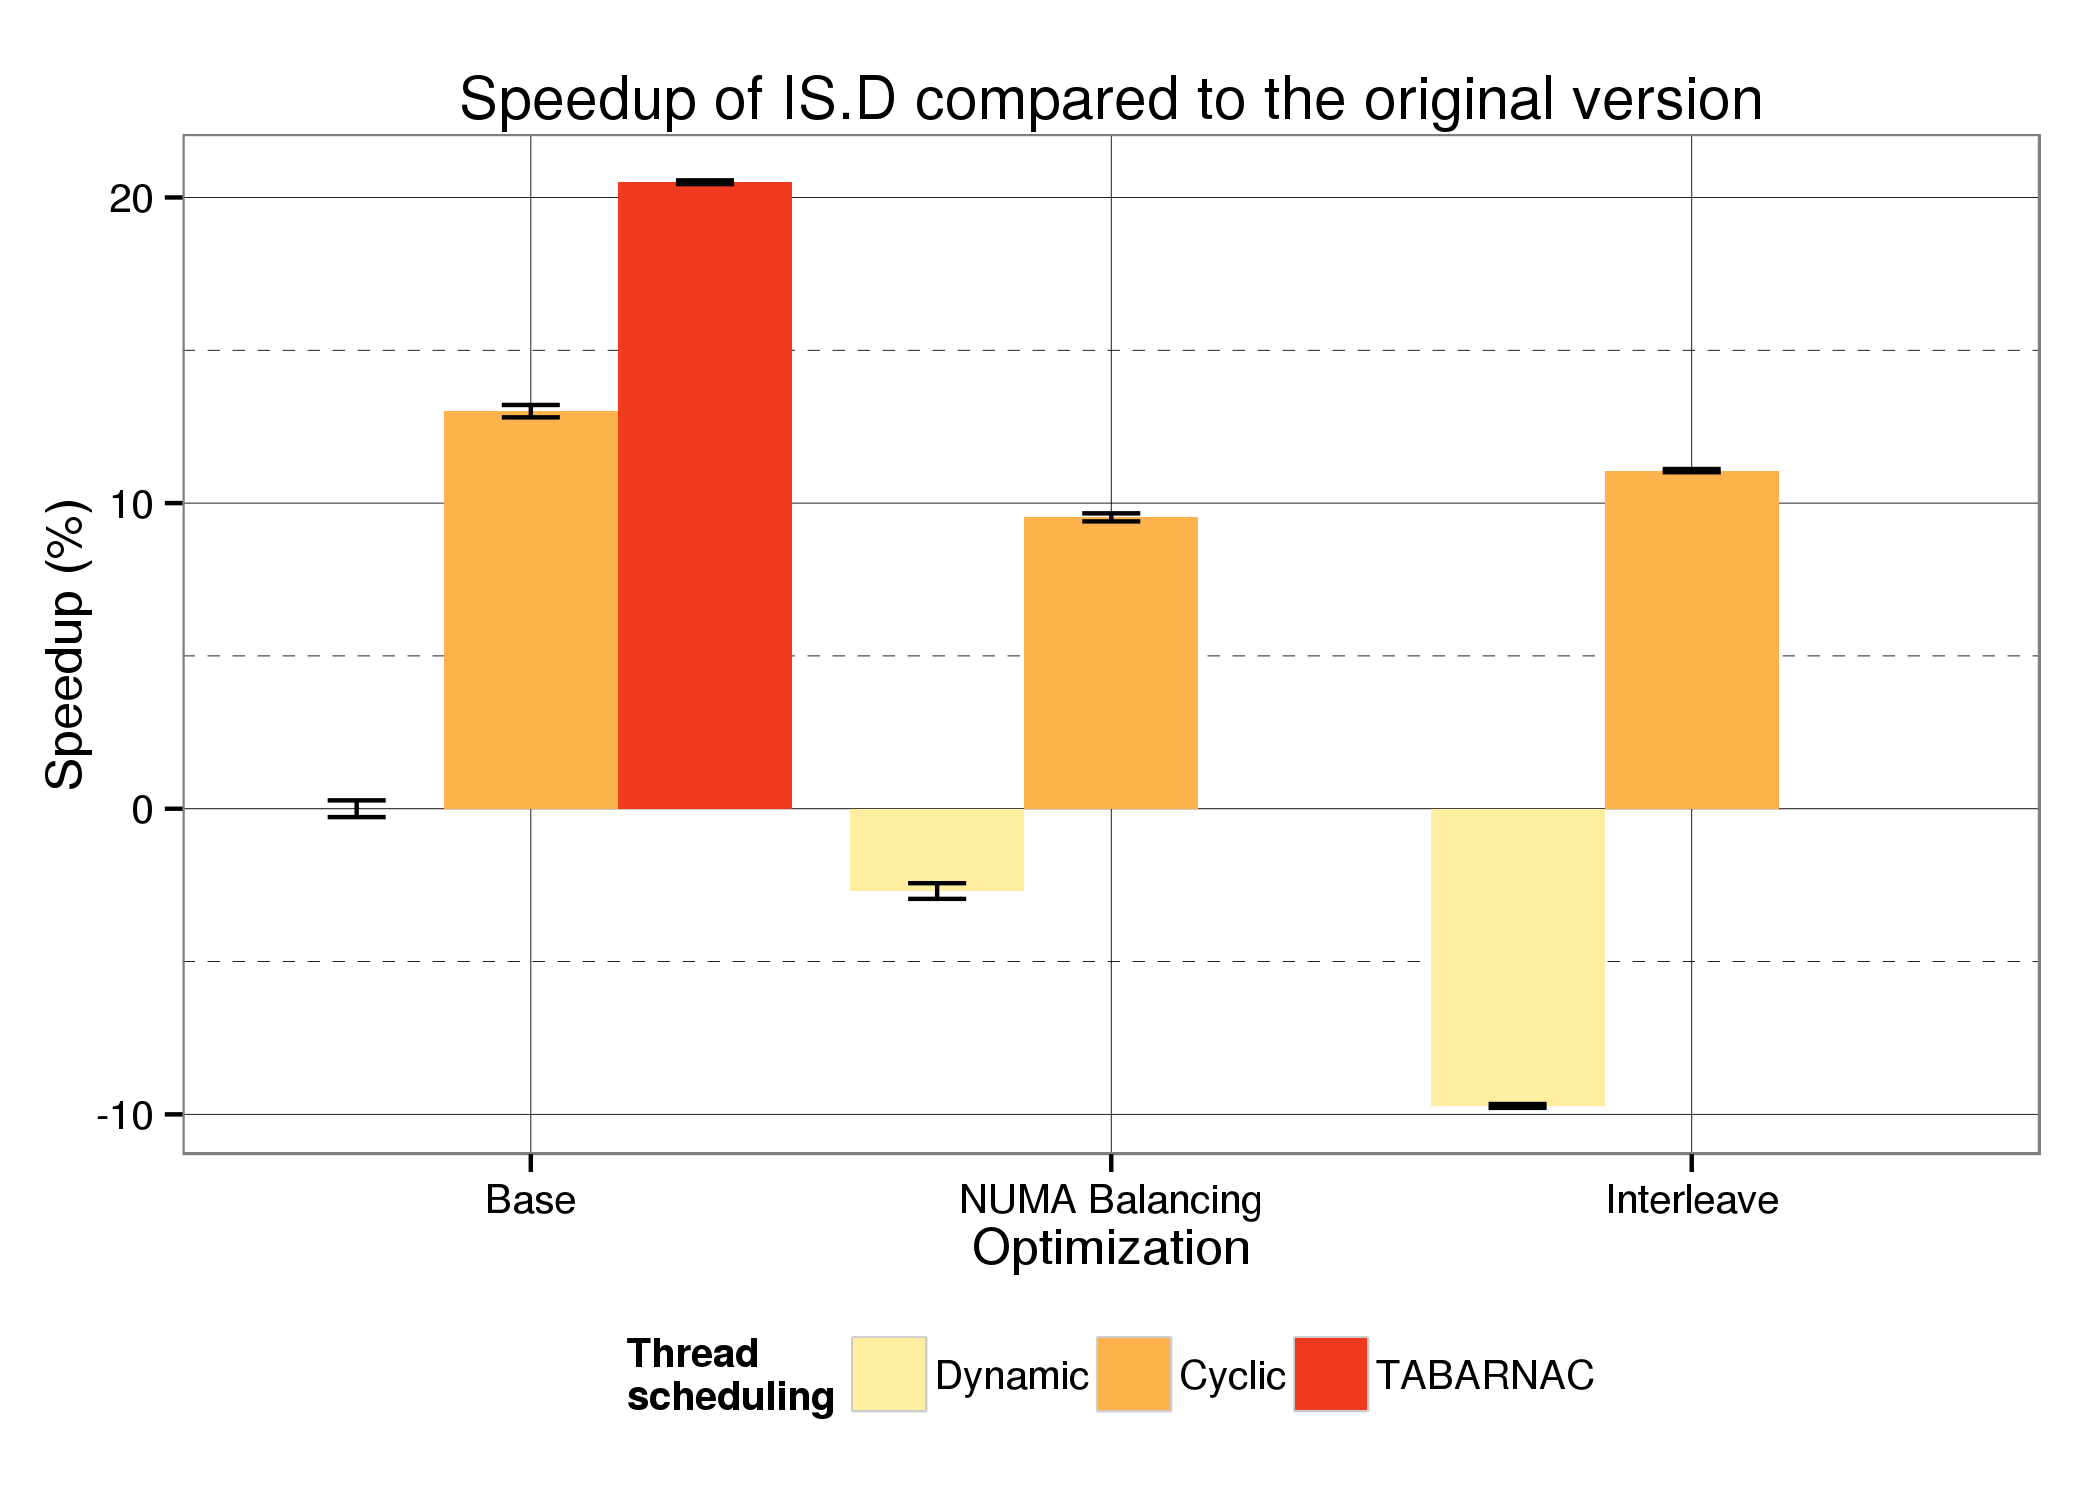
The figure above shows the speedup of IS compared to the default version (Dynamic) for each scheduling method and for each optimization technique. The first thing to notice is that with the default Dynamic scheduling, both Interleave and NUMA Balancing slow the application down, by up to 10%. This shows that simple optimization policies can actually reduce performance for NUMA-unaware code. The Cyclic scheduling, proposed in the original code, already provides up to 13% of speedup. We can see that both interleave and NUMA Balancing are not suitable for this scheduling, since they reduce the performance gains. The *TABARNAC* version provides more than 20% of speedup with a very small code modification. This example shows how analyzing an application's memory behavior can lead to significant execution time improvement on an already optimized application where automatic techniques can actually slow the application down.